


Costco (COST) is currently in Phase 11 of its 18-phase Adhishthana Cycle on the weekly chart. While the stock has enjoyed a strong rally and its bullish structure remains intact, the Adhishthana Principles now suggest a possible peak may have been formed. Here’s a closer look at what's unfolding.
Costco's Adhishthana Himalayan Formation
According to Adhishthana Principles, a stock typically breaks out of its Cakra formation in Phase 9 and enters a strong upward move. This rally initiates the Himalayan Formation -- a mountain-like structure where the stock ascends, peaks, and eventually descends.
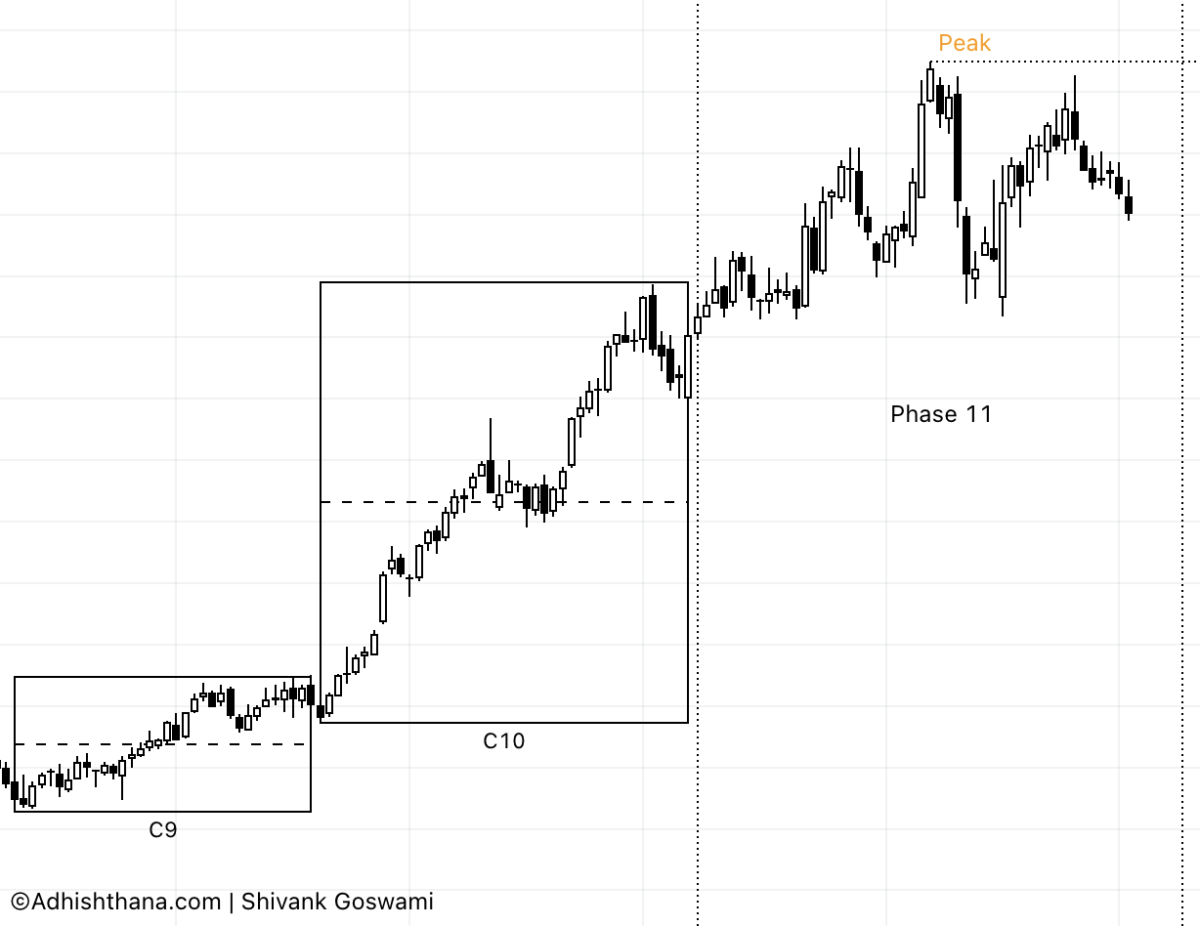
Costco followed this pattern closely. In Phase 9, it confirmed a breakout from its Cakra and rallied ~23%. This upward momentum accelerated in Phase 10, where the stock surged another ~66%, showing no signs of a peak, confirming that the stock was still climbing the Himalayan formation.
"The 18th interval is expected to be the level of peak formation; if not, then the 23rd interval. If this phase concludes without forming the peak, it is anticipated to occur in the following phases."
-- Adhishthana: The Principles That Govern Wealth, Time & Tragedy
During Phase 10, no peak was formed in the 18–23 bar range, which points to Phase 11 as the likely candidate for peak formation.
In Phase 11, the stock made an all-time high of $1078.23, then failed to reclaim that level and has since declined roughly 11%. This behavior suggests the possibility that the peak has already been made, and Costco may now be entering the descent phase of the Himalayan structure.
The Monthly Chart Tells a Similar Yet Subtle Story
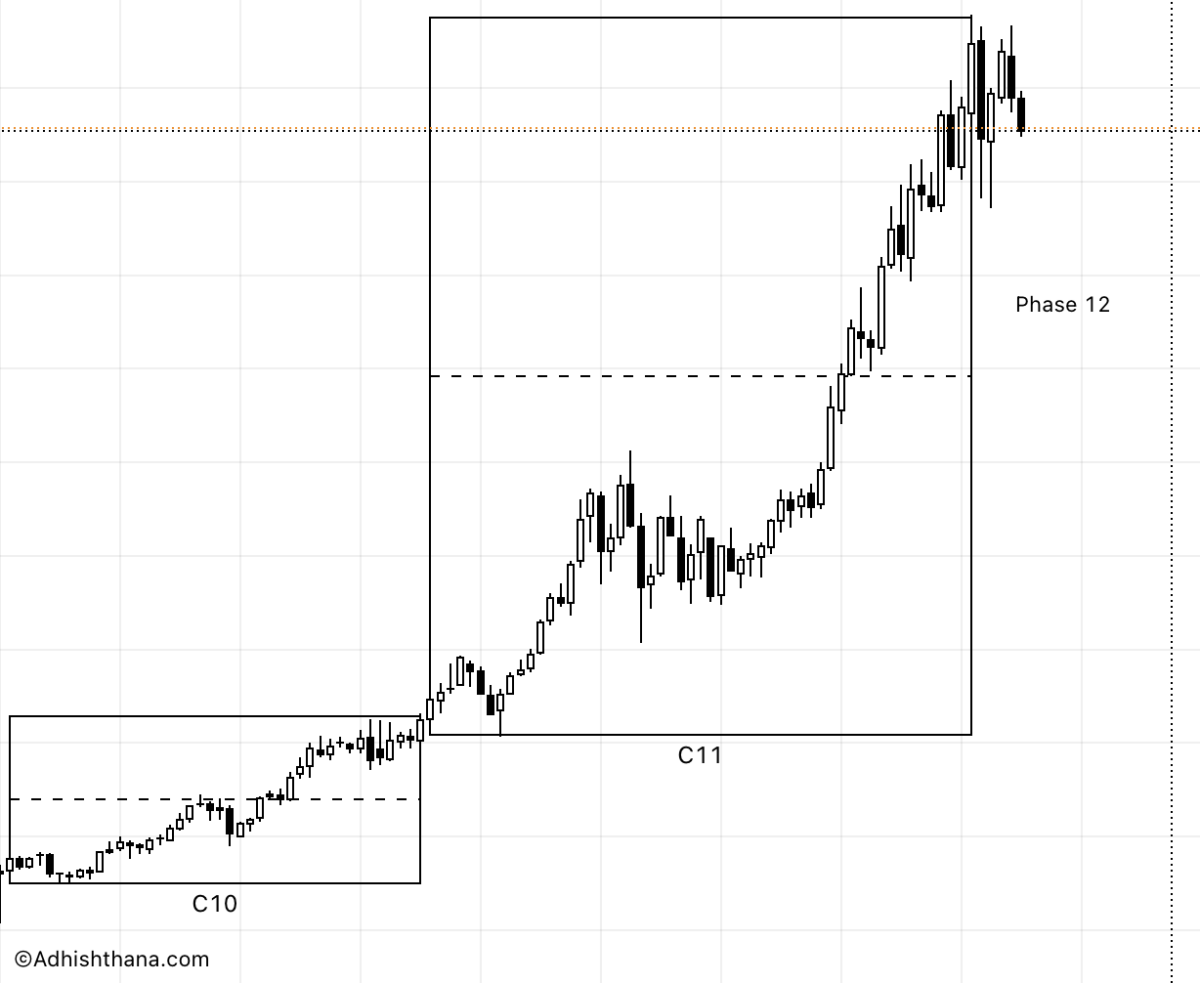
Costco is currently in Phase 12 of its monthly Adhishthana cycle. Much like the weekly pattern, the stock broke out of its Cakra in Phase 9 and rallied strongly through Phases 10 and 11.
Interestingly, on the monthly chart, the stock did not make a peak in either Phase 10 or 11, which is rare but recognized in the Adhishthana framework:
"Apart from these two cases, there is another scenario where peak formation does not occur in both C10 and C11. In this case, C12 also follows the upward trend, resulting in one of the most massive rallies--further highlighting the sheer magnitude and power of the Himalayas." -- Adhishthana: The Principles That Govern Wealth, Time & Tragedy
To understand whether a peak has already formed, it's important to closely examine the last bar of Phase 11 on the monthly chart, which is when Costco reached its all-time high of $1078.23.
If the weekly analysis suggesting a peak is accurate, then this final bar of Phase 11 would be recognized as the top on the monthly chart as well, effectively ruling out the possibility of a larger rally ahead.
However, if Costco breaks above $1078.23 during monthly Phase 12, it would indicate that Phase 11 did not mark the peak, and the stock may still be in the midst of a powerful rally aligned with the Himalayan Formation.
Investor Outlook: Watch This Level
Whether a peak has already formed or not remains uncertain, but there are signs pointing to a possible reversal.
Investors should watch the $893.62 level closely -- this is the Phase 10 high on the weekly chart. If this level is broken before Phase 11 concludes, it would confirm the descent has begun, and the peak was indeed made at $1078.23.
- If $893.62 is breached, prepare for a potentially sharp decline.
- If $1078.23 is taken out, the rally continues, and Costco could enter its most powerful phase yet.
For prudent portfolio management, investors might consider tightening stop-losses or taking partial profits as the stock approaches these key technical thresholds, and be prepared to re-engage if a confirmed breakout emerges. This approach allows for flexibility amidst the ambiguity of peak formation and leverages the structure offered by the Adhishthana cycle.